

May 20, 2025
This release introduces new capabilities and usability improvements, including:
☠️ 🎯 Detection Models can now be configured to identify srcip & dstip as Attacker, Target, Originator, or Service
A new naming complexity score is available in DNS metrics
Cloud Traffic Source API Endpoint /vpc/ adds support for retrieving traffic sources by name or type
Usability Enhancements
Traffic Top Table Column Filters has a new Sort by Count option
Main navigation menu is automatically collapsed when in Settings
Unpinning a dashboard asks for a confirmation before removing
☠️ 🎯 Detection Models can now be configured to identify srcip & dstip as Attacker, Target, Originator, or Service
There are 2 new configurable fields in a detection model in the section Disposition - srcip and dstip.
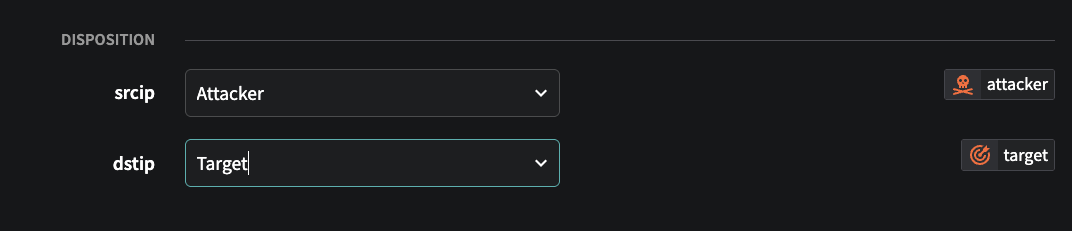
These fields can be set to identify the role of the source and destination IPs in the detection. Being able to quickly identify which IP is the attacker vs target (or originator vs service) is valuable information when investigating an event as flow records represent a unidirectional communication, so it may not be intuitive or obvious as to which IP is which (eg the srcip can be the target of an attack in certain detections, and the dstip the attacker).
If the field(s) are set and an event is created from the detection model, the icons below are shown in the Fusion Portal next to the IP in the events tables to identify which side of the detection that IP represents.
You can set these fields in any detection model, but it is not required and can be left blank. This field will only affect events that are triggered after the value is set in the detection model.
📘Disposition Field ValuesThe values the Disposition
srcipanddstipfields can be set to are:
IP is identified as the source or initiator
IP is the recipient or victim
IP initiated the communication
IP is providing a network service
🚧System Detection Models have been updated to set these fieldsThe disposition fields have been populated for all relevant system detection models. If you have modified any system detection models or created your own models, you will need to set the disposition values for those models yourself. Contact Netography Support if you need any assistance with this process.
🧮 A new naming complexity score is available in DNS metrics
A new naming complexity score for DNS domains, hosts, and names is now available as metrics you can use in the Fusion Portal, and threshold metrics you can create detection models using. This score makes it easier to identify, sort, or trigger detections based on domains, hosts, and names that are algorithmically generated vs. human-readable.
ℹ️DNS Complexity Score ExplainedThe DNS complexity score quantifies how visually and structurally complex a domain name is, using a weighted combination of five normalized metrics. The score is a number between 0 and 1, where 0 is least complex and 1 is most complex.
Calculating DNS complexity
Complexity is calculated using the following metrics: • Shannon Entropy (30%): Measures how random or unpredictable the characters are. Higher values suggest more randomness, often associated with algorithmically generated or suspicious domains. • Length (20%): Considers the number of characters on a logarithmic scale; longer domains are generally more complex, but this factor is capped so it doesn’t dominate. • Charset Size (20%): Counts the number of unique Unicode characters; larger sets indicate greater complexity, especially in internationalized domain names (IDNs). • Kolmogorov Complexity (20%): Approximates how compressible the string is; repetitive domains are less complex, while irregular patterns score higher. • Script Diversity (10%): Flags the presence of multiple writing scripts (e.g., Latin and Cyrillic), which often signals homoglyph spoofing.
All metrics are normalized to
[0, 1], and the final score is calculated as:Score = 0.3 × Entropy + 0.2 × Length + 0.2 × Charset + 0.2 × Kolmogorov + 0.1 × DiversityComplexity Score Range
0.0 - 0.2
Very simple, standard domains (e.g., apple.com, test.org)
0.3 - 0.6
Moderate complexity—domains with some randomness, length, or unique character usage
> 0.6
High complexity—random-looking, mixed-script, or visually confusing domains
Examples
0.61
g7f3-x8p9z.com
High entropy, mix of numbers and letters, non-dictionary—indicative of potential algorithmic generation
0.68
googlе.com (with Cyrillic е)
Script diversity is elevated by mixing Latin and Cyrillic, raising suspicion of homoglyph spoofing
0.22
россия.рф
Legitimate Cyrillic IDN—no script mixing, moderate complexity from unique Unicode chars.
DNS Metrics for complexity score
avgscoredomain - Average of the query.complexity.domain over a provided interval
avgscorehost - Average of the query.complexity.host over a provided interval
avgscorename - Average of the query.complexity.name over a provided interval
DNS Threshold Metrics for complexity score
These new threshold metrics are available for use in DNS detection models:
query.complexity.domain - The score of domain name complexity
query.complexity.host - The score of host complexity
query.complexity.name - The score of name complexity
query.depth - DNS query depth
Explaining DNS field names
name
gts-flowlogs-6782317327123-prod.s3.us-west-2.amazonaws.com
host
gts-flowlogs-6782317327123-prod
domain
amazonaws.com
⚒️ Cloud Traffic Source API Endpoint /vpc/ adds support for retrieving traffic sources by name or type
/vpc/ adds support for retrieving traffic sources by name or typeIf you are using the API to automate cloud traffic sources, these API changes will help you make more efficient calls:
List All VPCs filters
The List All VPCs endpoint now allows you to filter by flow type (e.g. aws, azure, gcp), traffic type (e.g. flow, dns), flow resource, and log type. This is particularly useful if you are building automation for a specific cloud and only want to retrieve the traffic sources for that cloud. See: https://docs.netography.com/reference/v1_vpc_get
e.g. /api/v1/vpc?flowtype=azure
Get VPC by Name
A new Get VPC by Name endpoint allows you to retrieve a traffic source by its name in Fusion. This is particularly useful if you are trying to retrieve the details of an existing traffic source, or have an established naming convention for traffic sources. Previously, you had to retrieve the list of all flow sources and then manually match the name field with its id. See: https://docs.netography.com/reference/v1_vpc_name_get
e.g. /api/v1/vpc/name/myazurevnet1
🖥️ Usability Enhancements
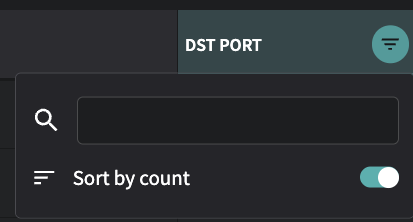
Traffic Top Table Column Filters has a new Sort by Count option
Traffic Top will show a count of how many additional items are present in fields such as Source, Src Port, and Dst Port. To see the columns sorted by the rows with the most or least items, you can now select the filter (the upside down triangle that appears when hovering over the column name) and enable Sort by Count to sort by the number of items, rather than by the alphanumeric sorting of the values in the column.
Main navigation menu is automatically collapsed when in Settings
When you select Settings in the Fusion Portal, the main navigation menu on the left is collapsed to just show the icons, in order to provide more screen space for the settings pages. The menu will be automatically expanded again when leaving the Settings menu. You can always expand and collapse the main navigation menu manually by selecting >> or << at the bottom-left of the browser window.
Unpinning a dashboard asks for a confirmation before removing
Pinning a dashboard makes it appear directly on the main navigation menu for easy access. You can pin a dashboard by going to Dashboards > All, then clicking the 3 dots in a circle in left-most column next to a dashboard, and selecting Pin. Unpin a dashboard by hovering over the dashboard name in the navigation menu, and then selecting the pin that appears next to it. Unpinning now has a confirmation pop-up that asks you to confirm before removing it from the menu.
Last updated