Release Notes 02/18/2025
This release includes enhancements to the Events views to streamline analyst workflows when reviewing and investigating events, and a new Detection Model function for building more robust detections.
New MITRE ATT&CK Framework Events View
There is a new Events by MITRE ATT&CK Framework page in the Events section of the left-hand menu (it is listed as Events by MITRE for short). This page categorizes events using the MITRE ATT&CK Framework Tactics and Techniques. Click any of the techniques listed on the heat map on the page to filter the event list by that technique.
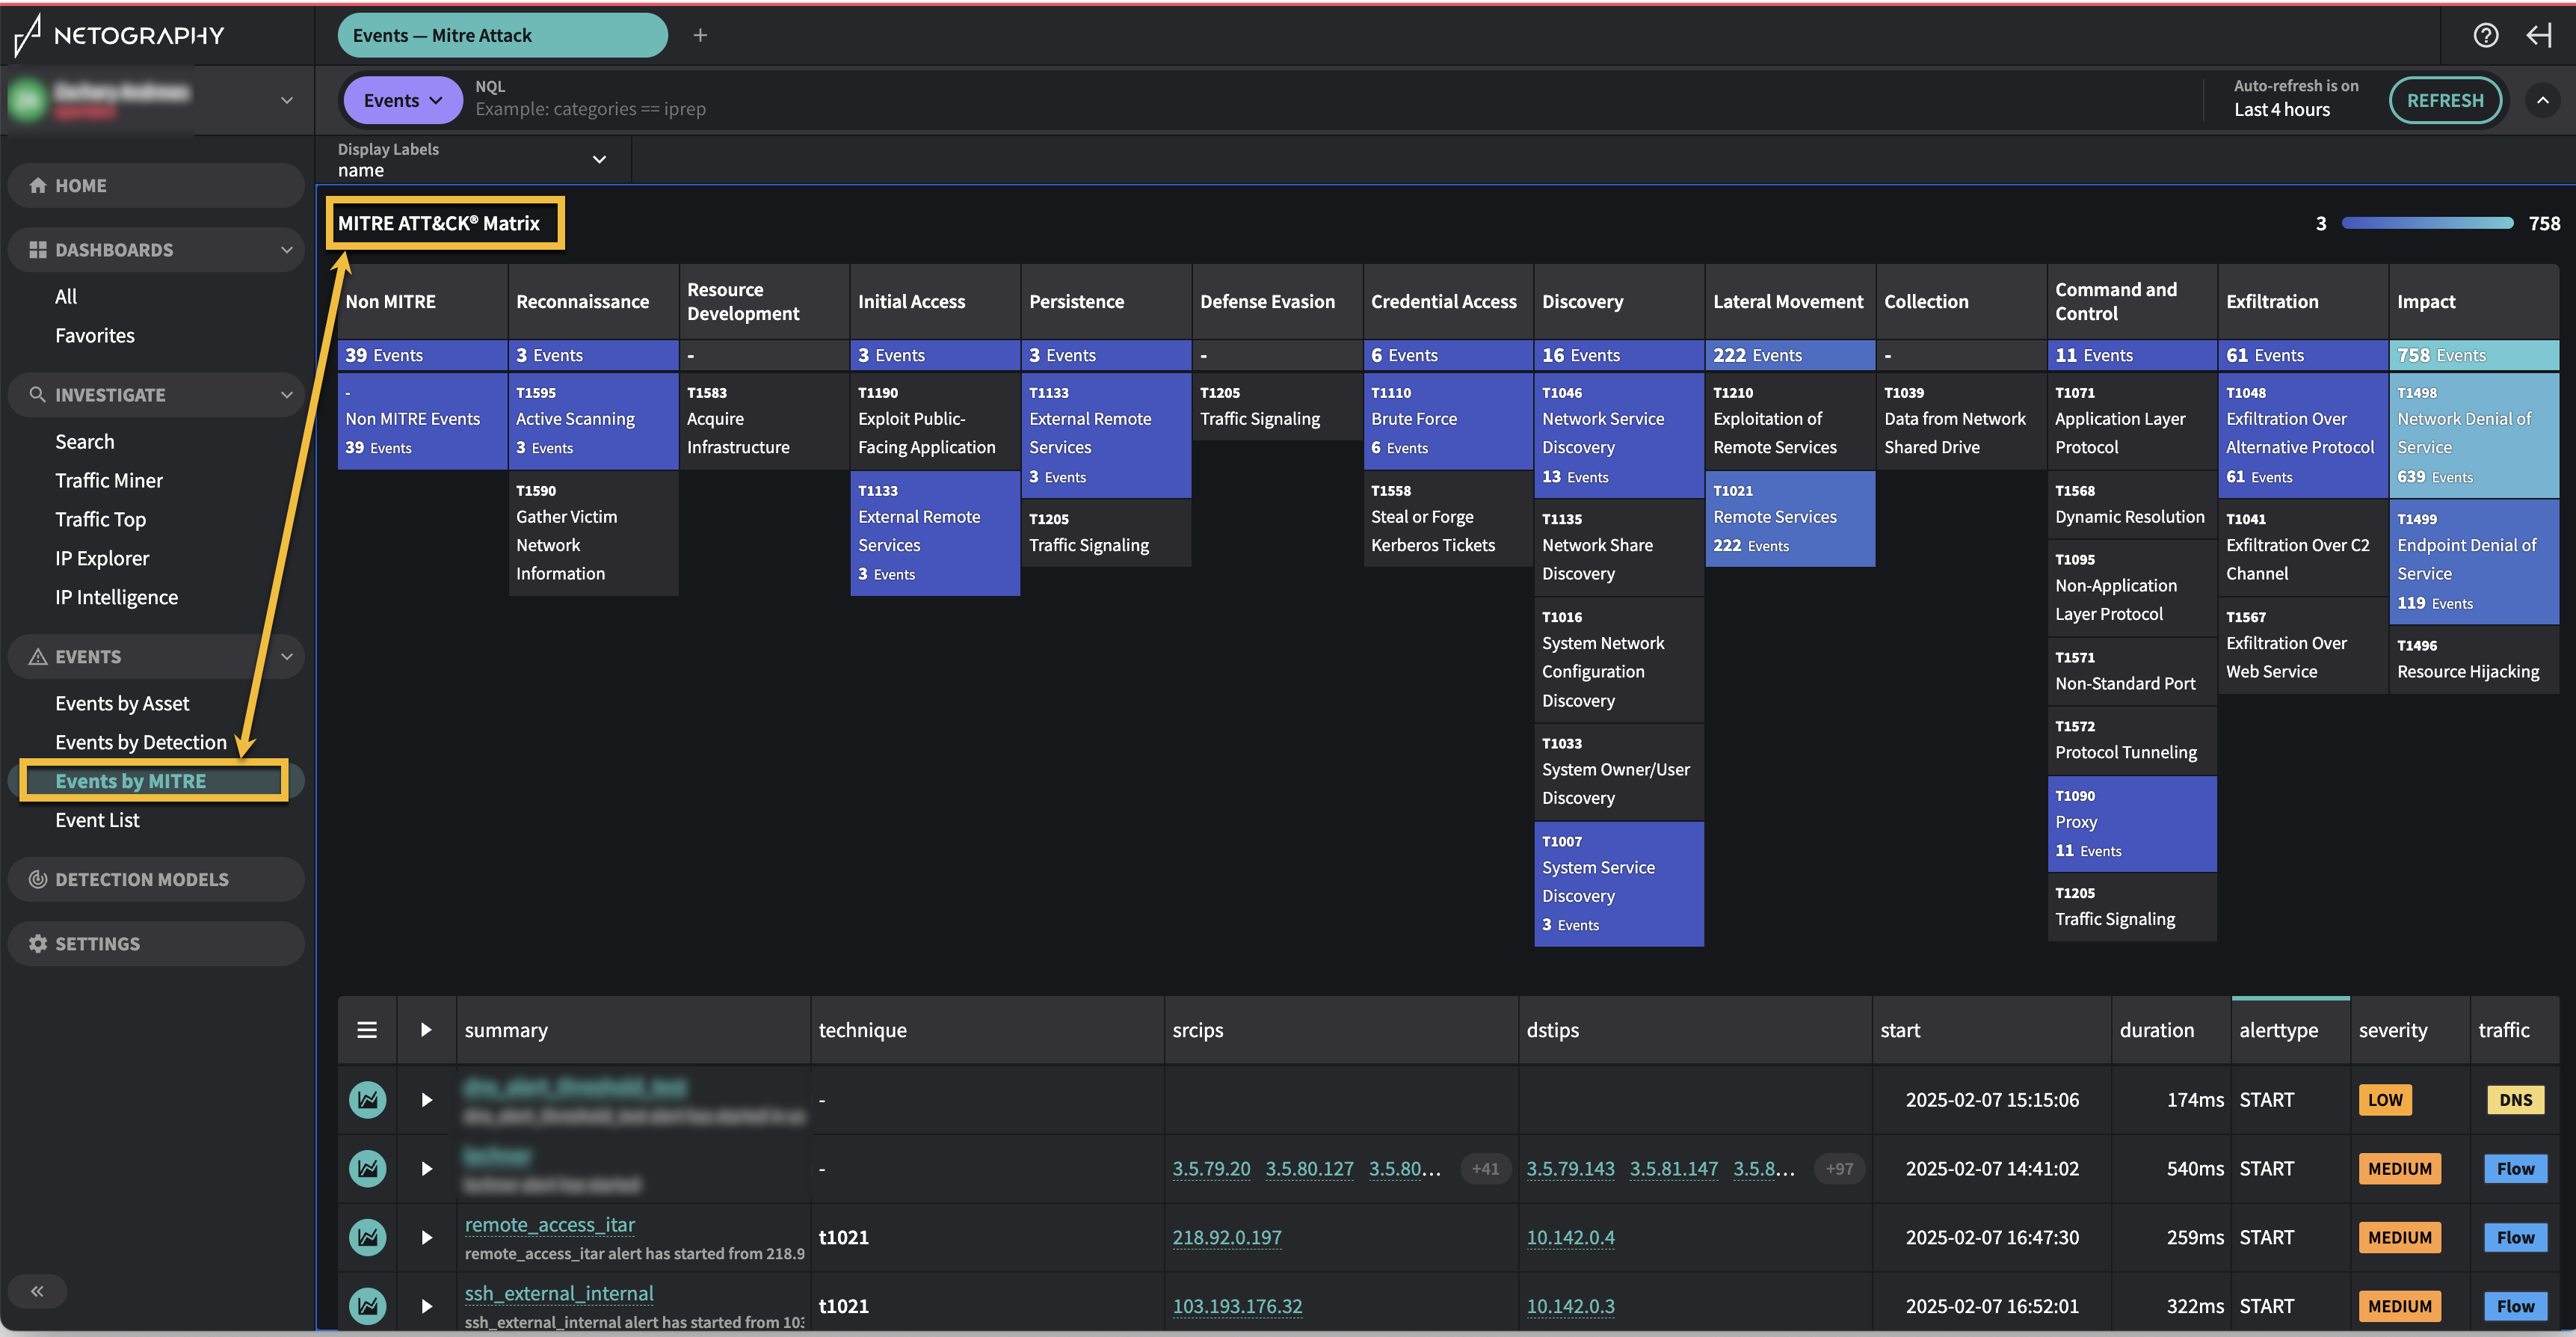
This view only includes events that were created on or after February 12, 2025
Only events that were created on or after 2/12/25 will appear in the Events by MITRE ATT&CK Framework view. If you open this page with a timeframe that includes dates prior to 2/12/25, you will still only see events that occurred since 2/12/25. To include older events, use the Events by Asset, Events by Detection, or Event List views.
Updated Event Details Page
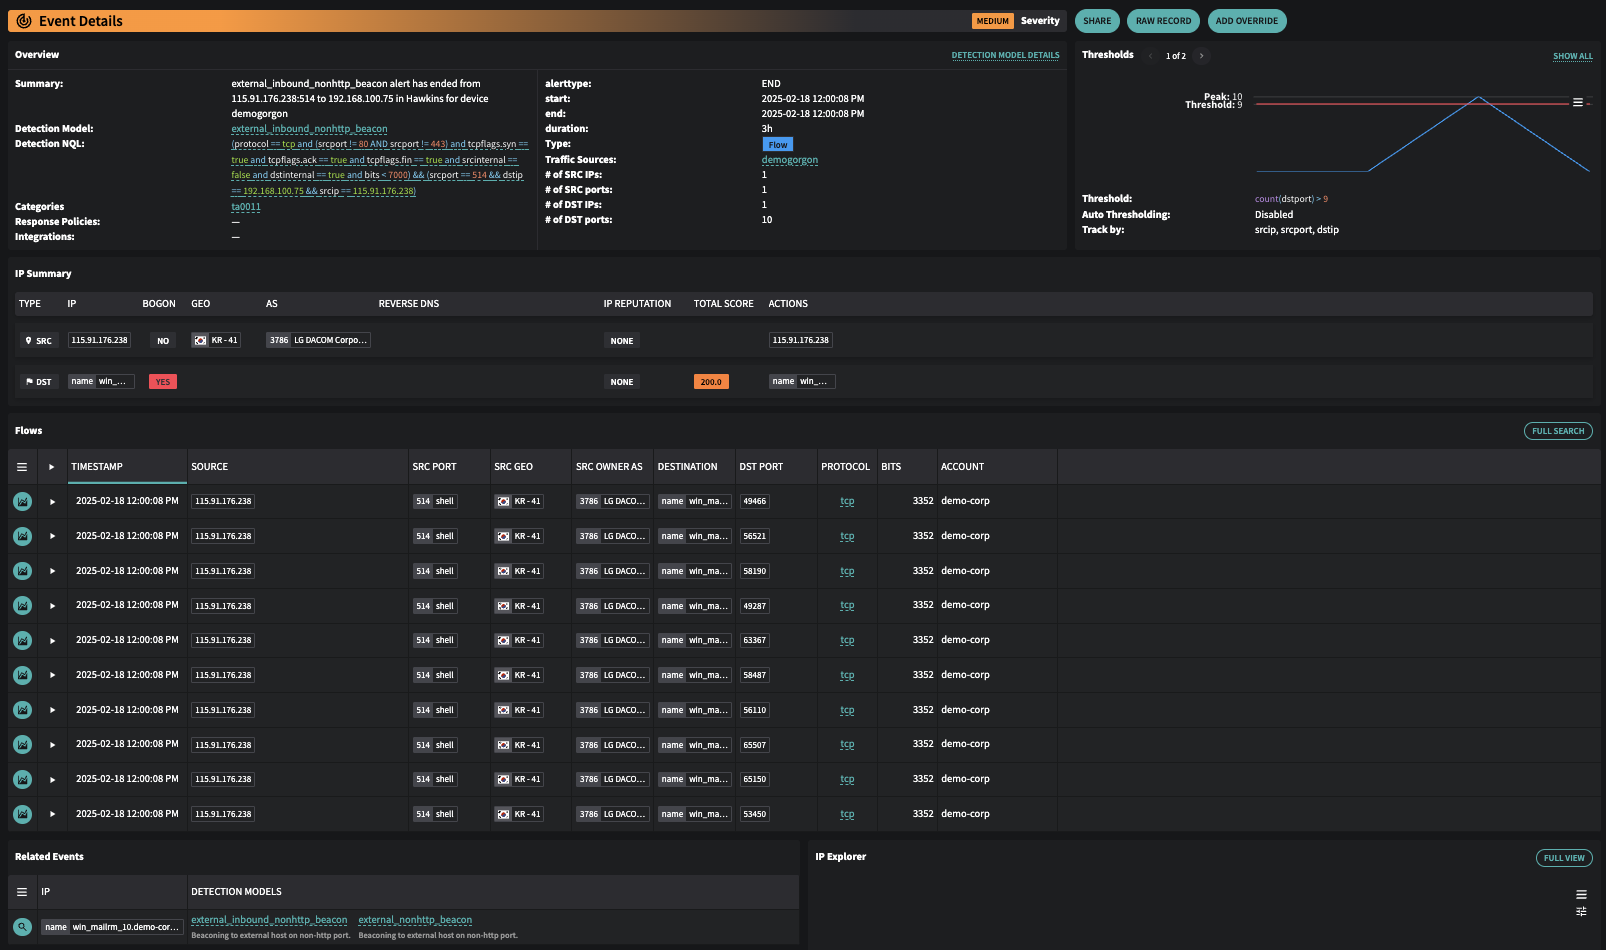
The Event Details page that appears when selecting the round icon to the left of an event in the event list or selecting Full Details in the Event Record Summary that appears when you click the right-hand triangle next to the event has been update to provide more valuable and actionable information on the page.
The new Event Details page now shows an IP Summary table, related Flows, related Events, and IP Explorer directly on the page. It also includes buttons and clickable links to get more directly to the most common next steps in investigating an event. Graphs have been reduced in size to provide more usable information on a single page, and the severity is more clearly indicated at the top of the page.
New Context Menu Options in tables with Right-Click
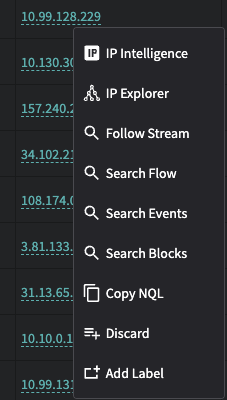
You can now right-click on items in the tables available (across multiple pages throughout Fusion) to bring up a context menu that gives you direct access to common actions you may want to take next relating to that table row. Some actions that were previously available by clicking an item and then finding the action in the property tray to the right of the screen can now be directly accessed with the Context menu instead.
For example, right-clicking on a name or IP address in a table brings up this context menu:
New maxin threshold function for Detection Models to handle high-latency ingest sources
maxin threshold function for Detection Models to handle high-latency ingest sourcesWhen setting a threshold in a Detection Model, a new function maxin(#,metric) is now available. This function performs a windowed aggregation of the given metric with a duration of seconds in the first argument.
For instance:
maxin(30, bits) > 10000
Translates to: _"if any period of 30 seconds across the entire rollup window has a total sum of bits for all records that exceeds 10000."
This is designed to allow traffic sources that may have late data ingest (eg latency in receiving flow logs or DNS resolver logs from a cloud provider) to have a rollup window that is long enough to account for the delay (up to 20 minutes) while not requiring aggregations for triggering that would hide “spikes” of data necessary for some detections. For example, if there is an acceptable baseline of failed queries, but a large number of failures in a short period of time is indicative of an attack.
While this threshold function will be primarily used by Netography's Detection Engineering to build more robust and accurate detection models, it is available directly to use in your own detection models as well. If you need more guidance or assistance leveraging this new function, contact Netography Support.