Release notes 05/21/2024
Several features have been updated in this release. We've made additional enhancements, too.
Security Overview dashboard update
In this release, the Security Overview dashboard has been updated.
| Previously | Currently |
|---|---|
| IP Reputation Flows | Top events (table) |
| Aggregate Risk | Top services in cloud environments |
| Bogon Flows | Top threat-related IP destinations |
| TCP Flag Distribution | Top events by srcip count (table) |
| Third Party File-Sharing Services | Top events by dstip count (table) |
| Third Party Remote Desktop Services | Top external talkers to internal services |
| Third Party VPN Usage | Top internal services by traffic from external sources |
| Threat Breakdown | Top internal to internal talkers by flow rate |
| Threats | Top Internal to internal cloud-to-cloud talkers by flow rate |
| Flows Spiral | Traffic to ITAR countries by flow data volume |
| Port Threat Breakdown | Top external destinations by flow data volume |
| Site | |
| Source Country | |
| Source IP Cardinality |
Context menu changes
Main navigation
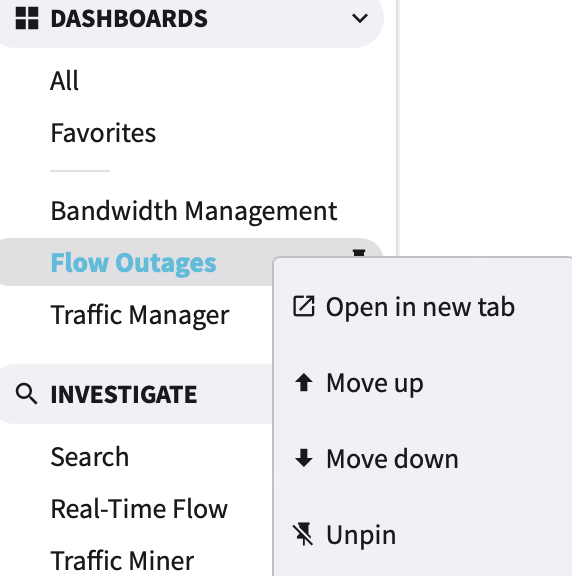
Pinned dashboards can now be managed using context menu options. After pinning a dashboard to the main navigation, right-clicking on its link will display one or more of the following options, depending on its current position.
- Open in new tab
- Move up
- Move down
- Unpin
Tables
The following table types display additional information using context menus. Tables include:
- Flows
- Events
- Blocks
When visible, right-click the leftmost chart icon to invoke the context menu.
Menu options
Full Details navigates you to a new tab displaying the record details page.
Raw Record open a pop-out window displaying the record's data.
Search Flow navigates you to a new tab displaying a pre-filled NQL Query search page based on the record selected.
Push to GF populates the Global Filter field with NQL based on the record selected.
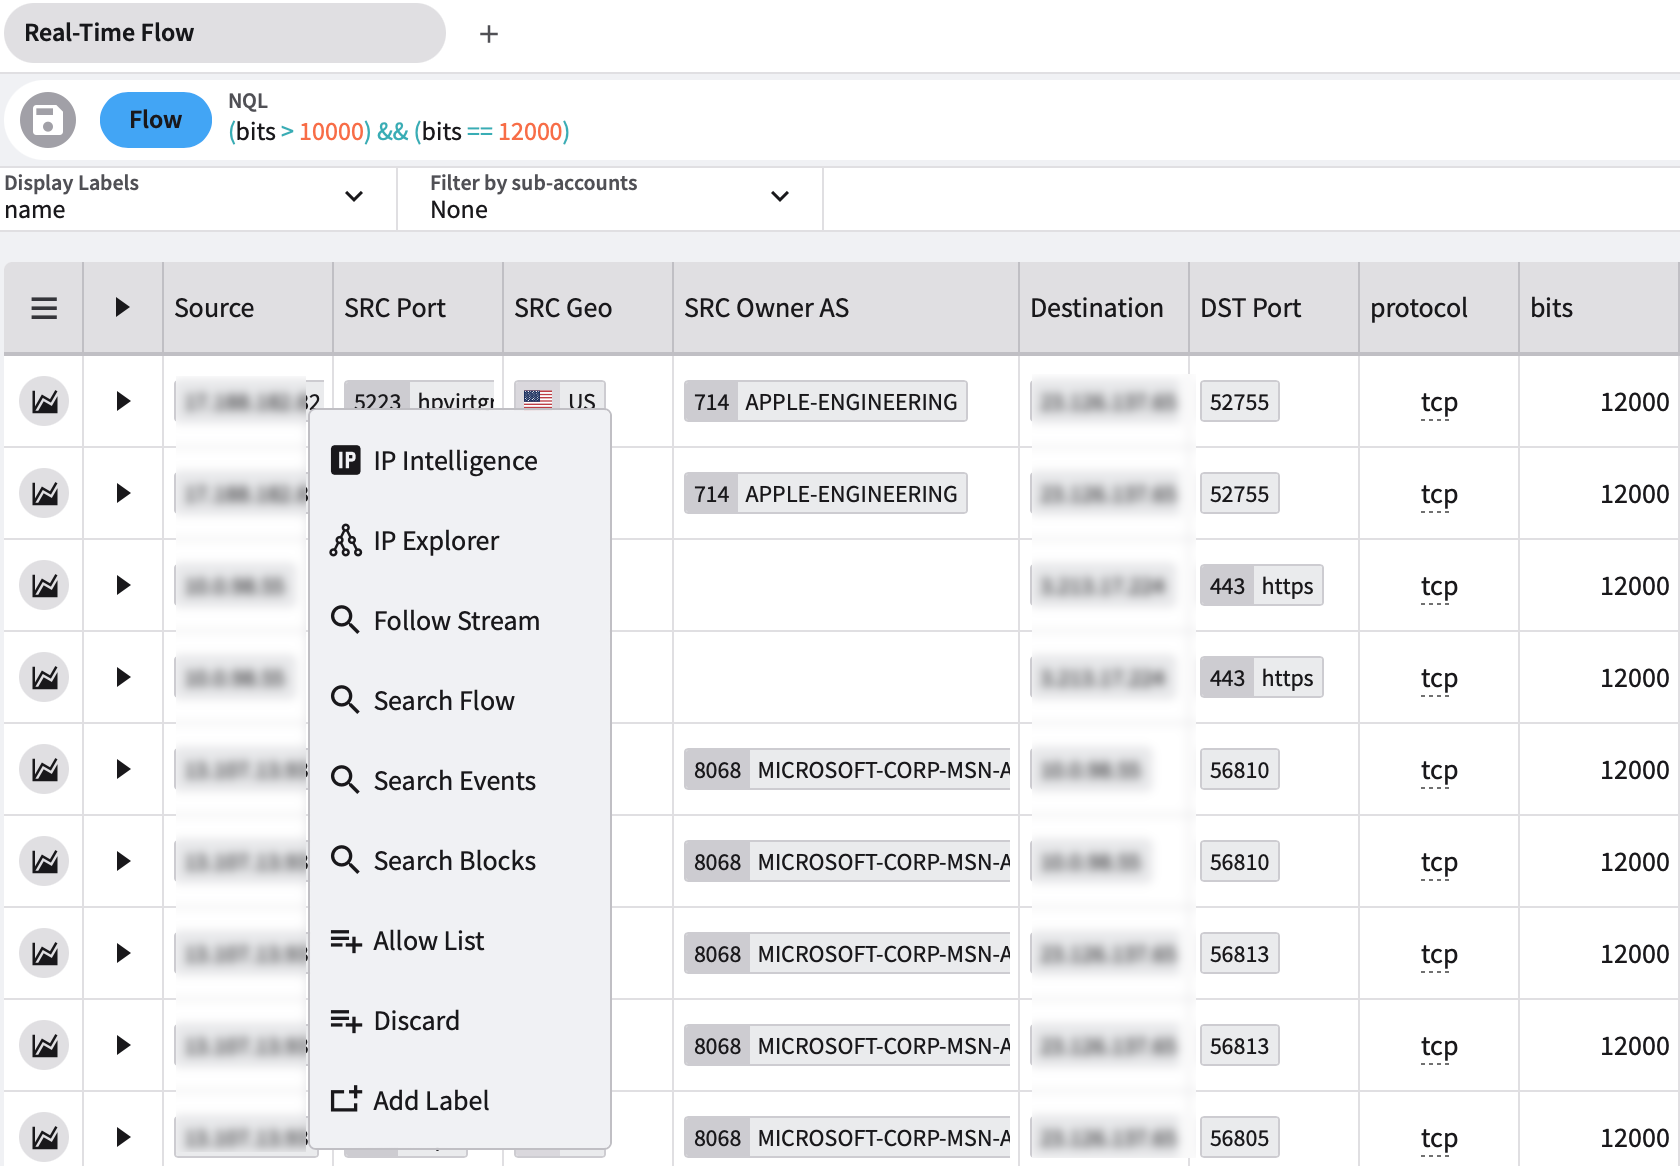
Table cells
Context menus now exist for most table cells displaying clickable data values.
For example, right-clicking the Source IP address in the first column in this image displays the following context menu options. Clicking an option opens the page in a new tab.
- IP Intelligence
- IP Explorer
- Flow Stream
- Search Flow
- Search Events
- Search Blocks
- Copy NQL
- Allow List
- Discard
- Add Label
Tabs
Pages displaying in tabs now have context menu options available.
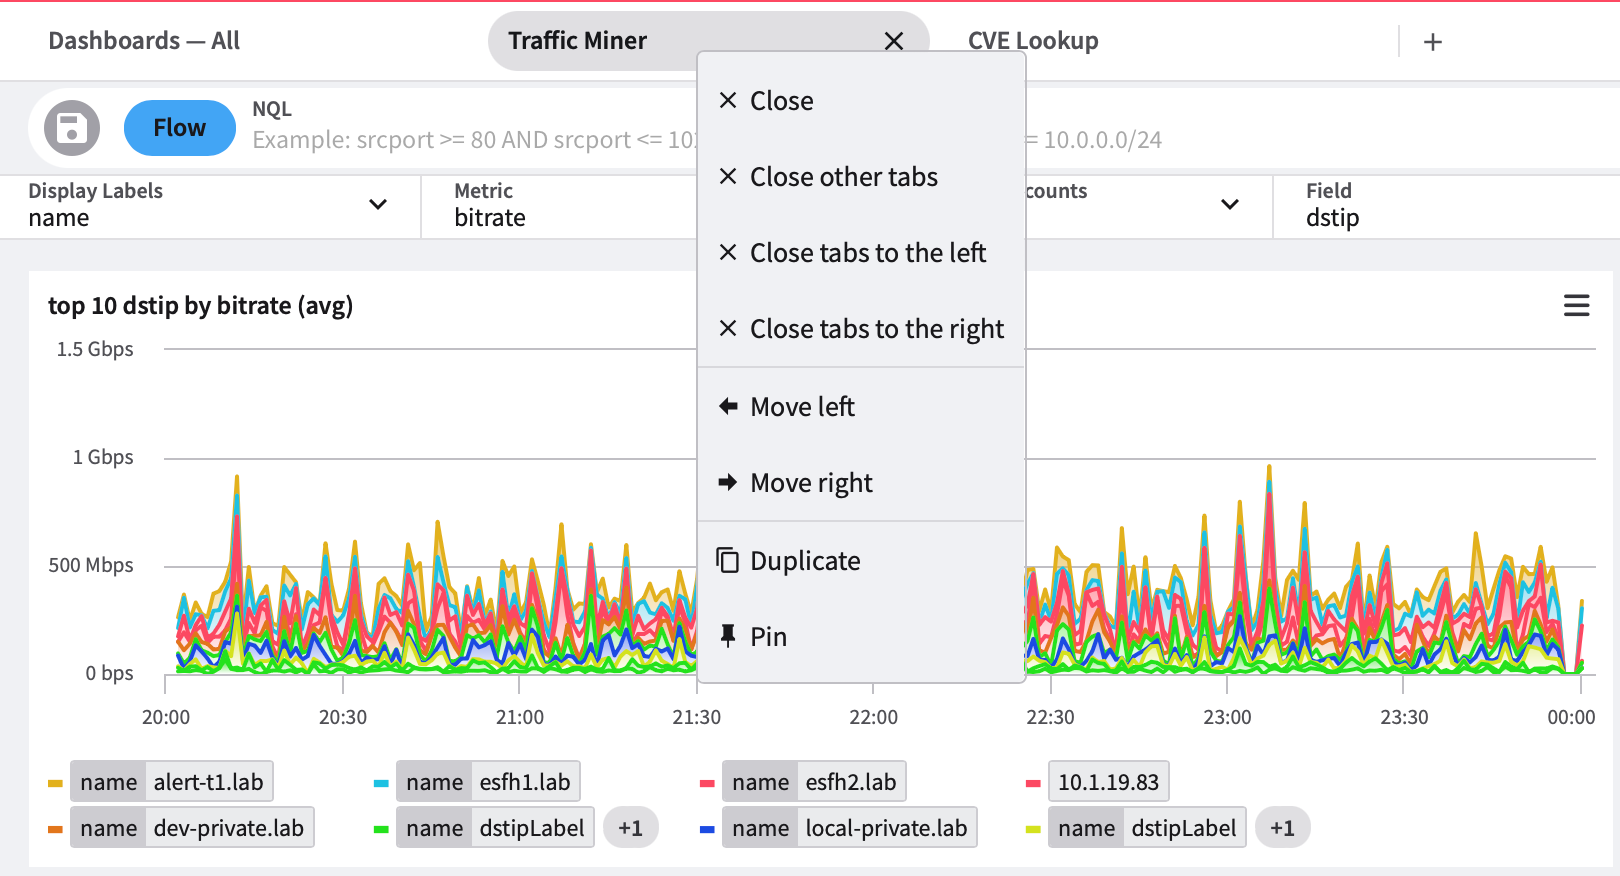
Unpinned tabs
Right-clicking on a tab displays its context menu. Some options depend on the tab's current position.
- Close closes the currently selected tab.
- Close other tabs closes all tabs except the currently selected tab unless the tab is pinned, and then it is not closed.
- Close tabs to the left closes all tabs to the left of the currently selected tab unless the tab is pinned, and then it is not closed.
- Close tabs to the right closes all tabs to the right of the currently selected tab unless the tab is pinned, and then it is not closed.
- Move left moves the currently selected tab one position left.
- Move right moves the currently selected tab one position to the right.
- Duplicate makes a copy of the currently selected tab and its settings and adds it to the tab bar.
- Pin pins the currently selected tab to the tab bar, where it will remain until it is unpinned from the tab bar.
Pinned tabs
When you pin a tab on the tab bar, it immediately moves to the leftmost or next leftmost position on the tab bar, and they (pinned tabs) are not affected by bulk close actions like “Close other tabs” or “Close tabs to the left,” for example.
Pinned tabs have 3 options on their context menus:
- Close
- Duplicate
- Unpin
Charts
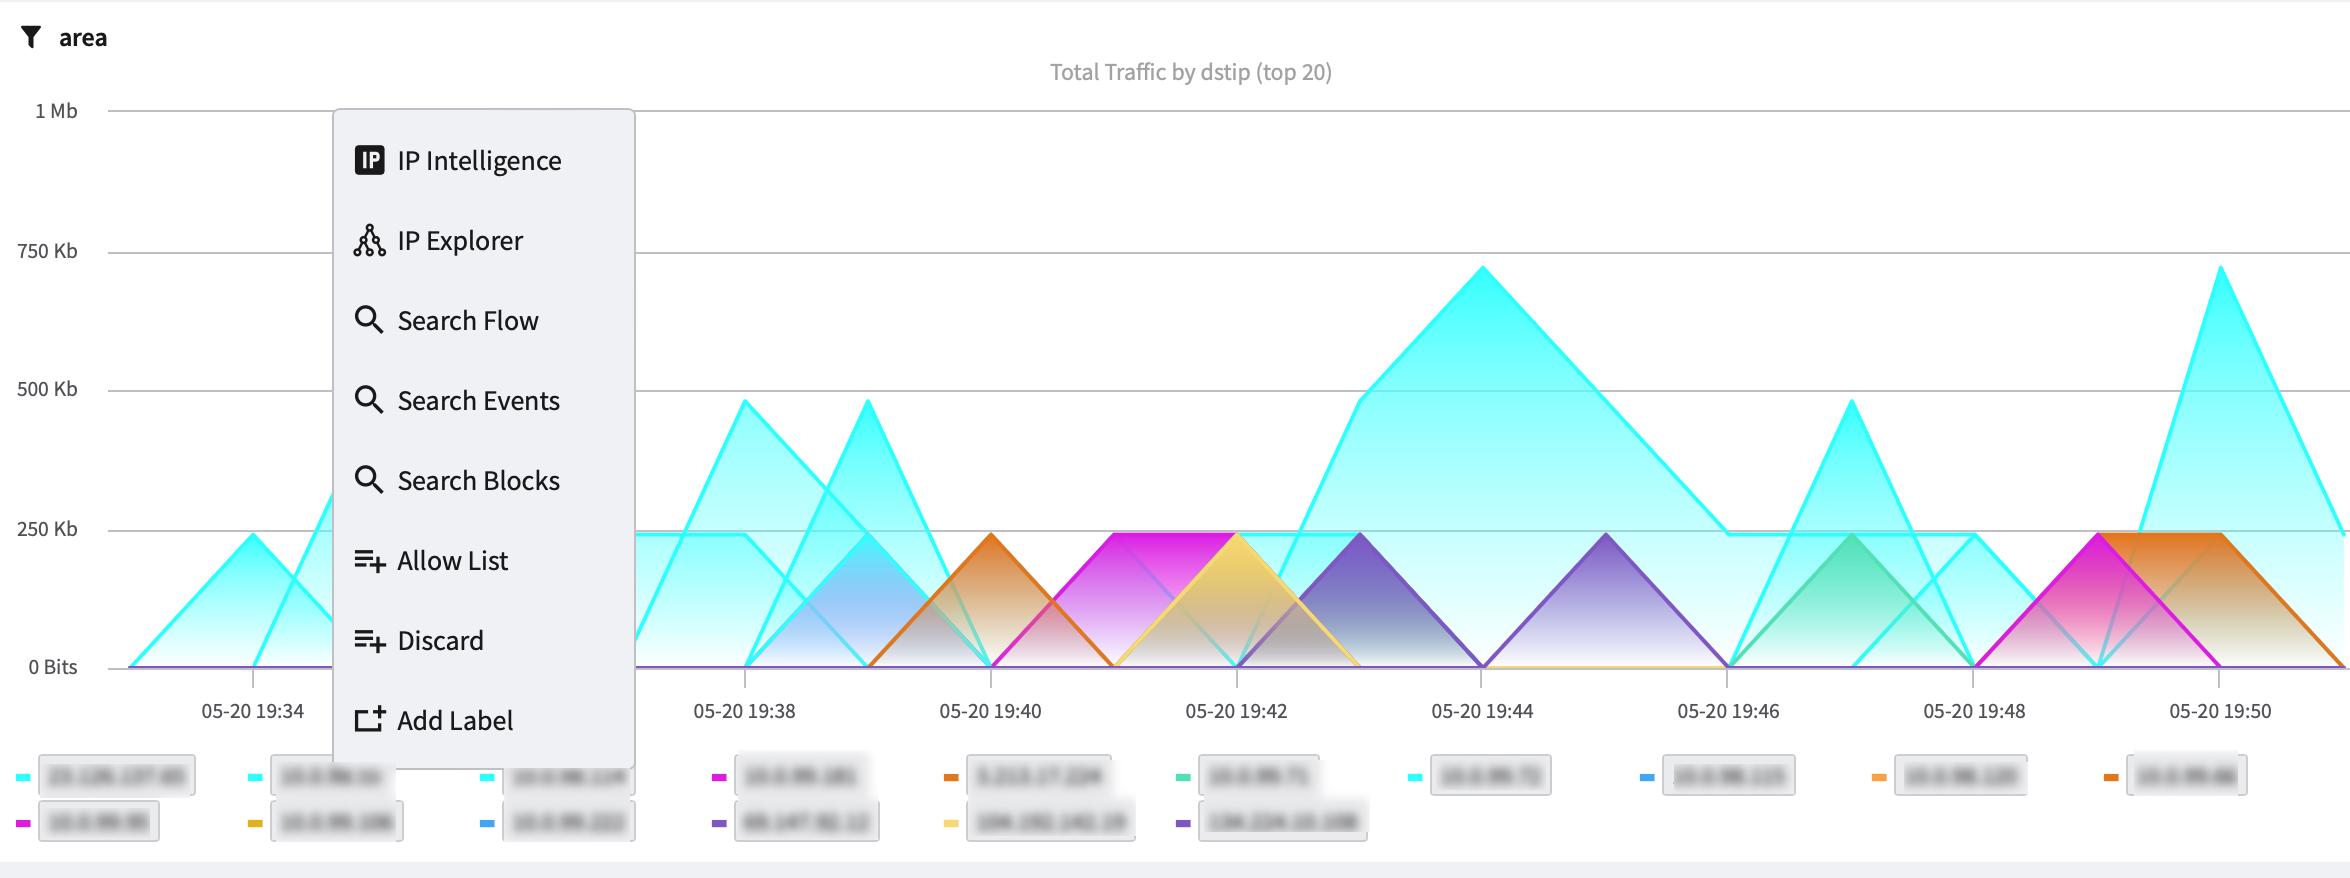
Context menu options can be displayed in charts by right-clicking in the chart legend area.
In the example image below, right-clicking the IP address area in the legend displays the following context menu options:
- IP Intelligence
- IP Explorer
- Search Flow
- Search Events
- Search Blocks
- Copy NQL
- Allow List
- Discard
- Add Label
Auto-load dashboard options
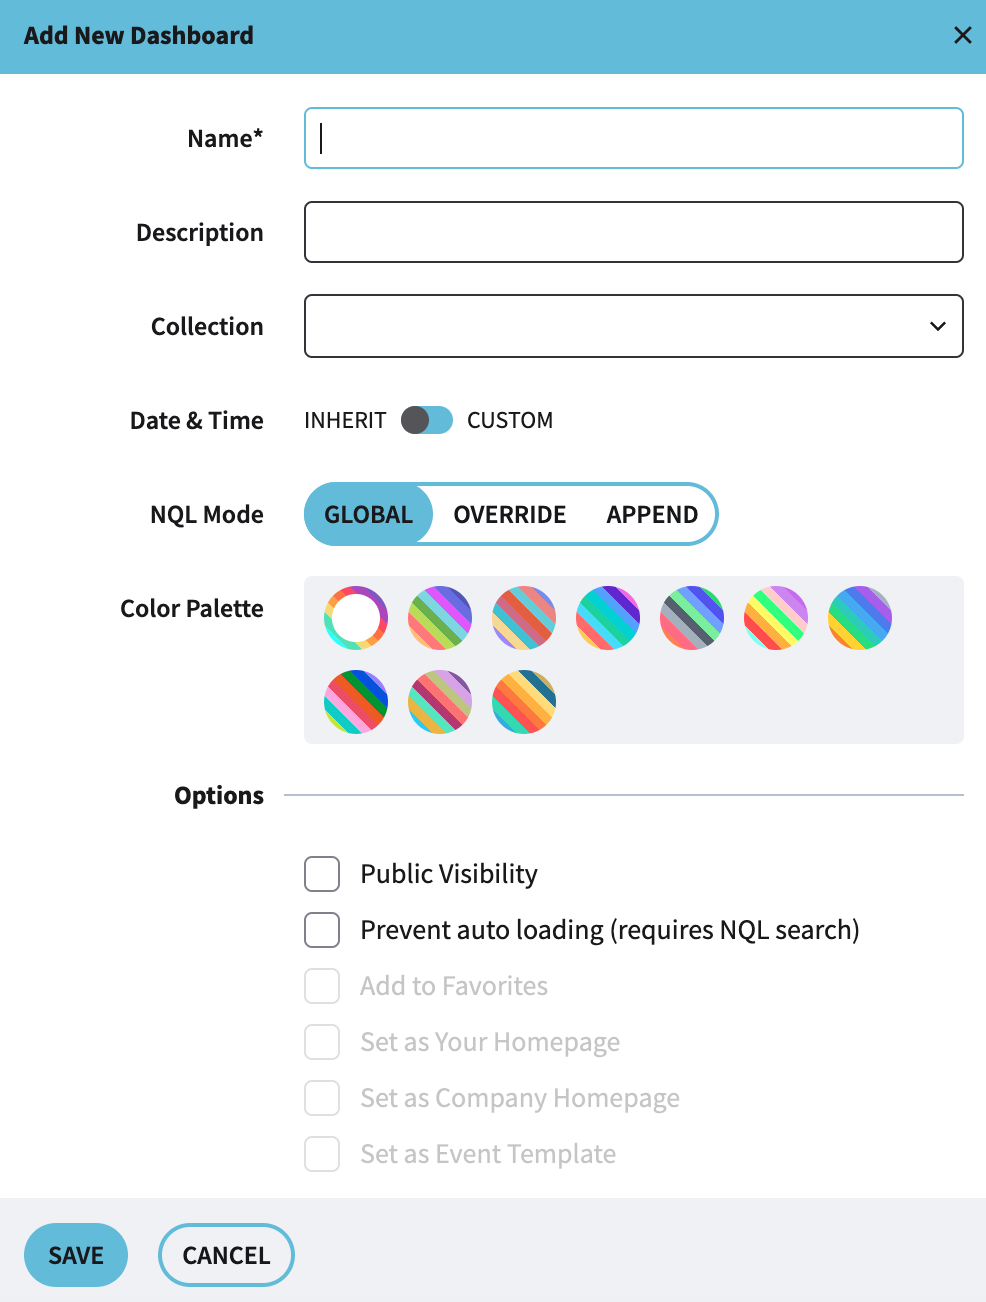
You can now opt to prevent custom dashboards from auto loading.
The Prevent auto loading option is displayed when creating a new custom dashboard or when changing the settings of a custom dashboard.
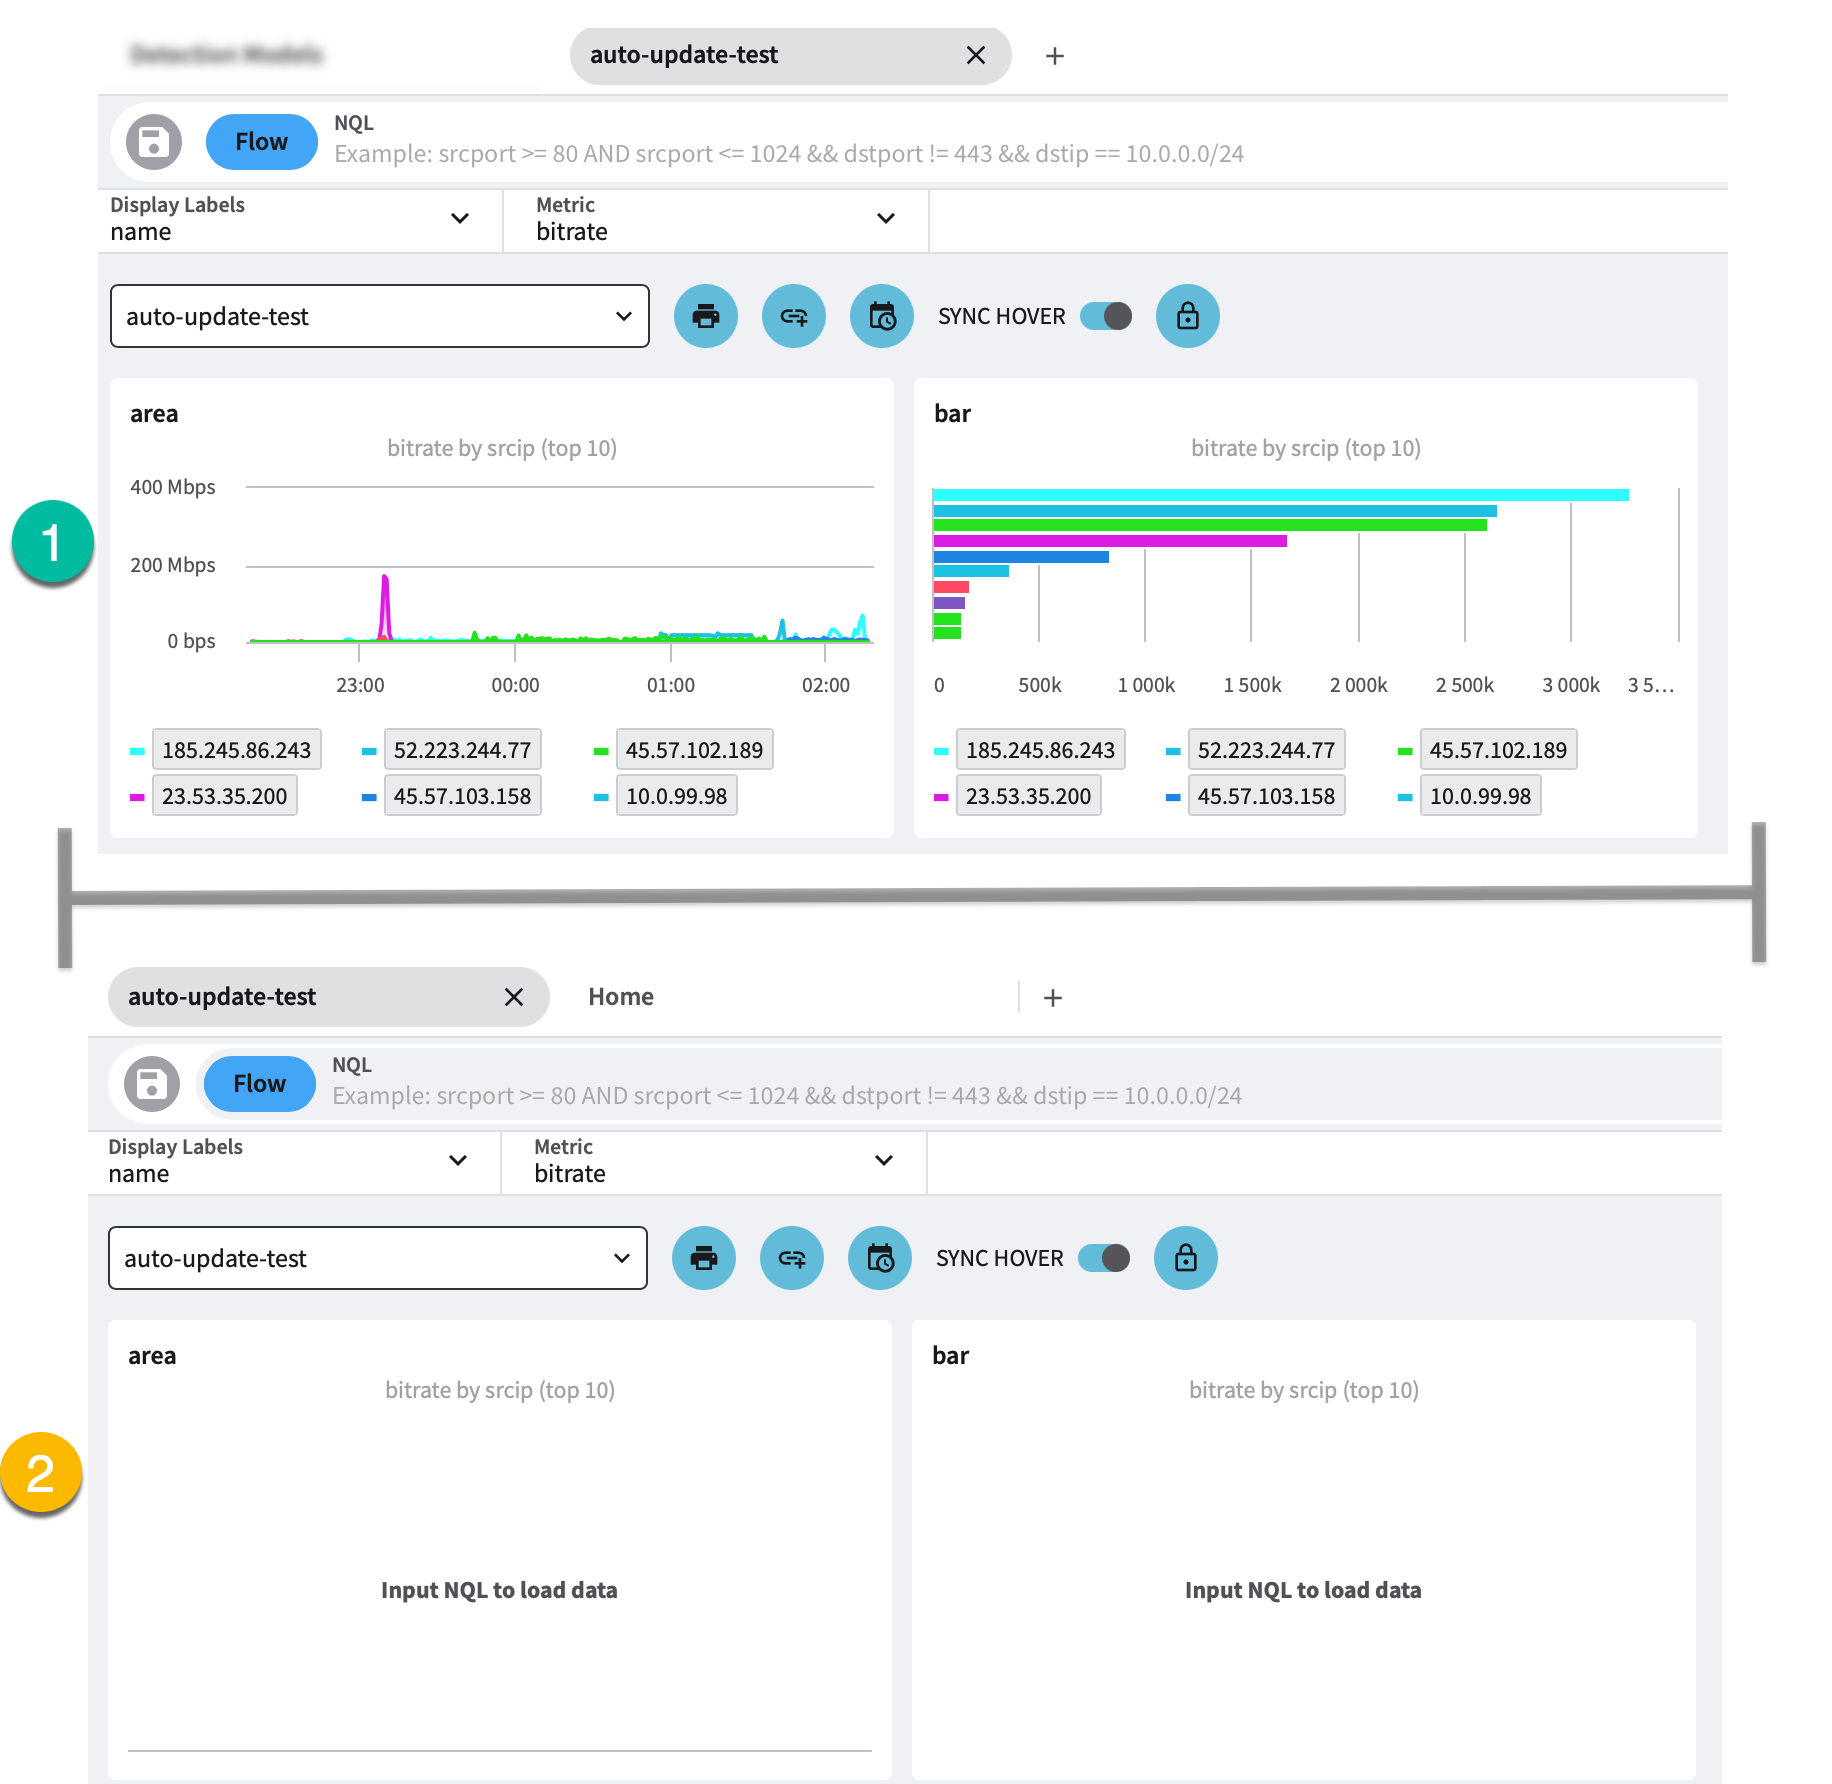
The image below displays the same dashboard without Prevent auto loading selected (1) and with Prevent auto loading selected (2).
When Prevent auto loading is checked, the Input NQL to load data message displays on the dashboard chart(s) and widgets.
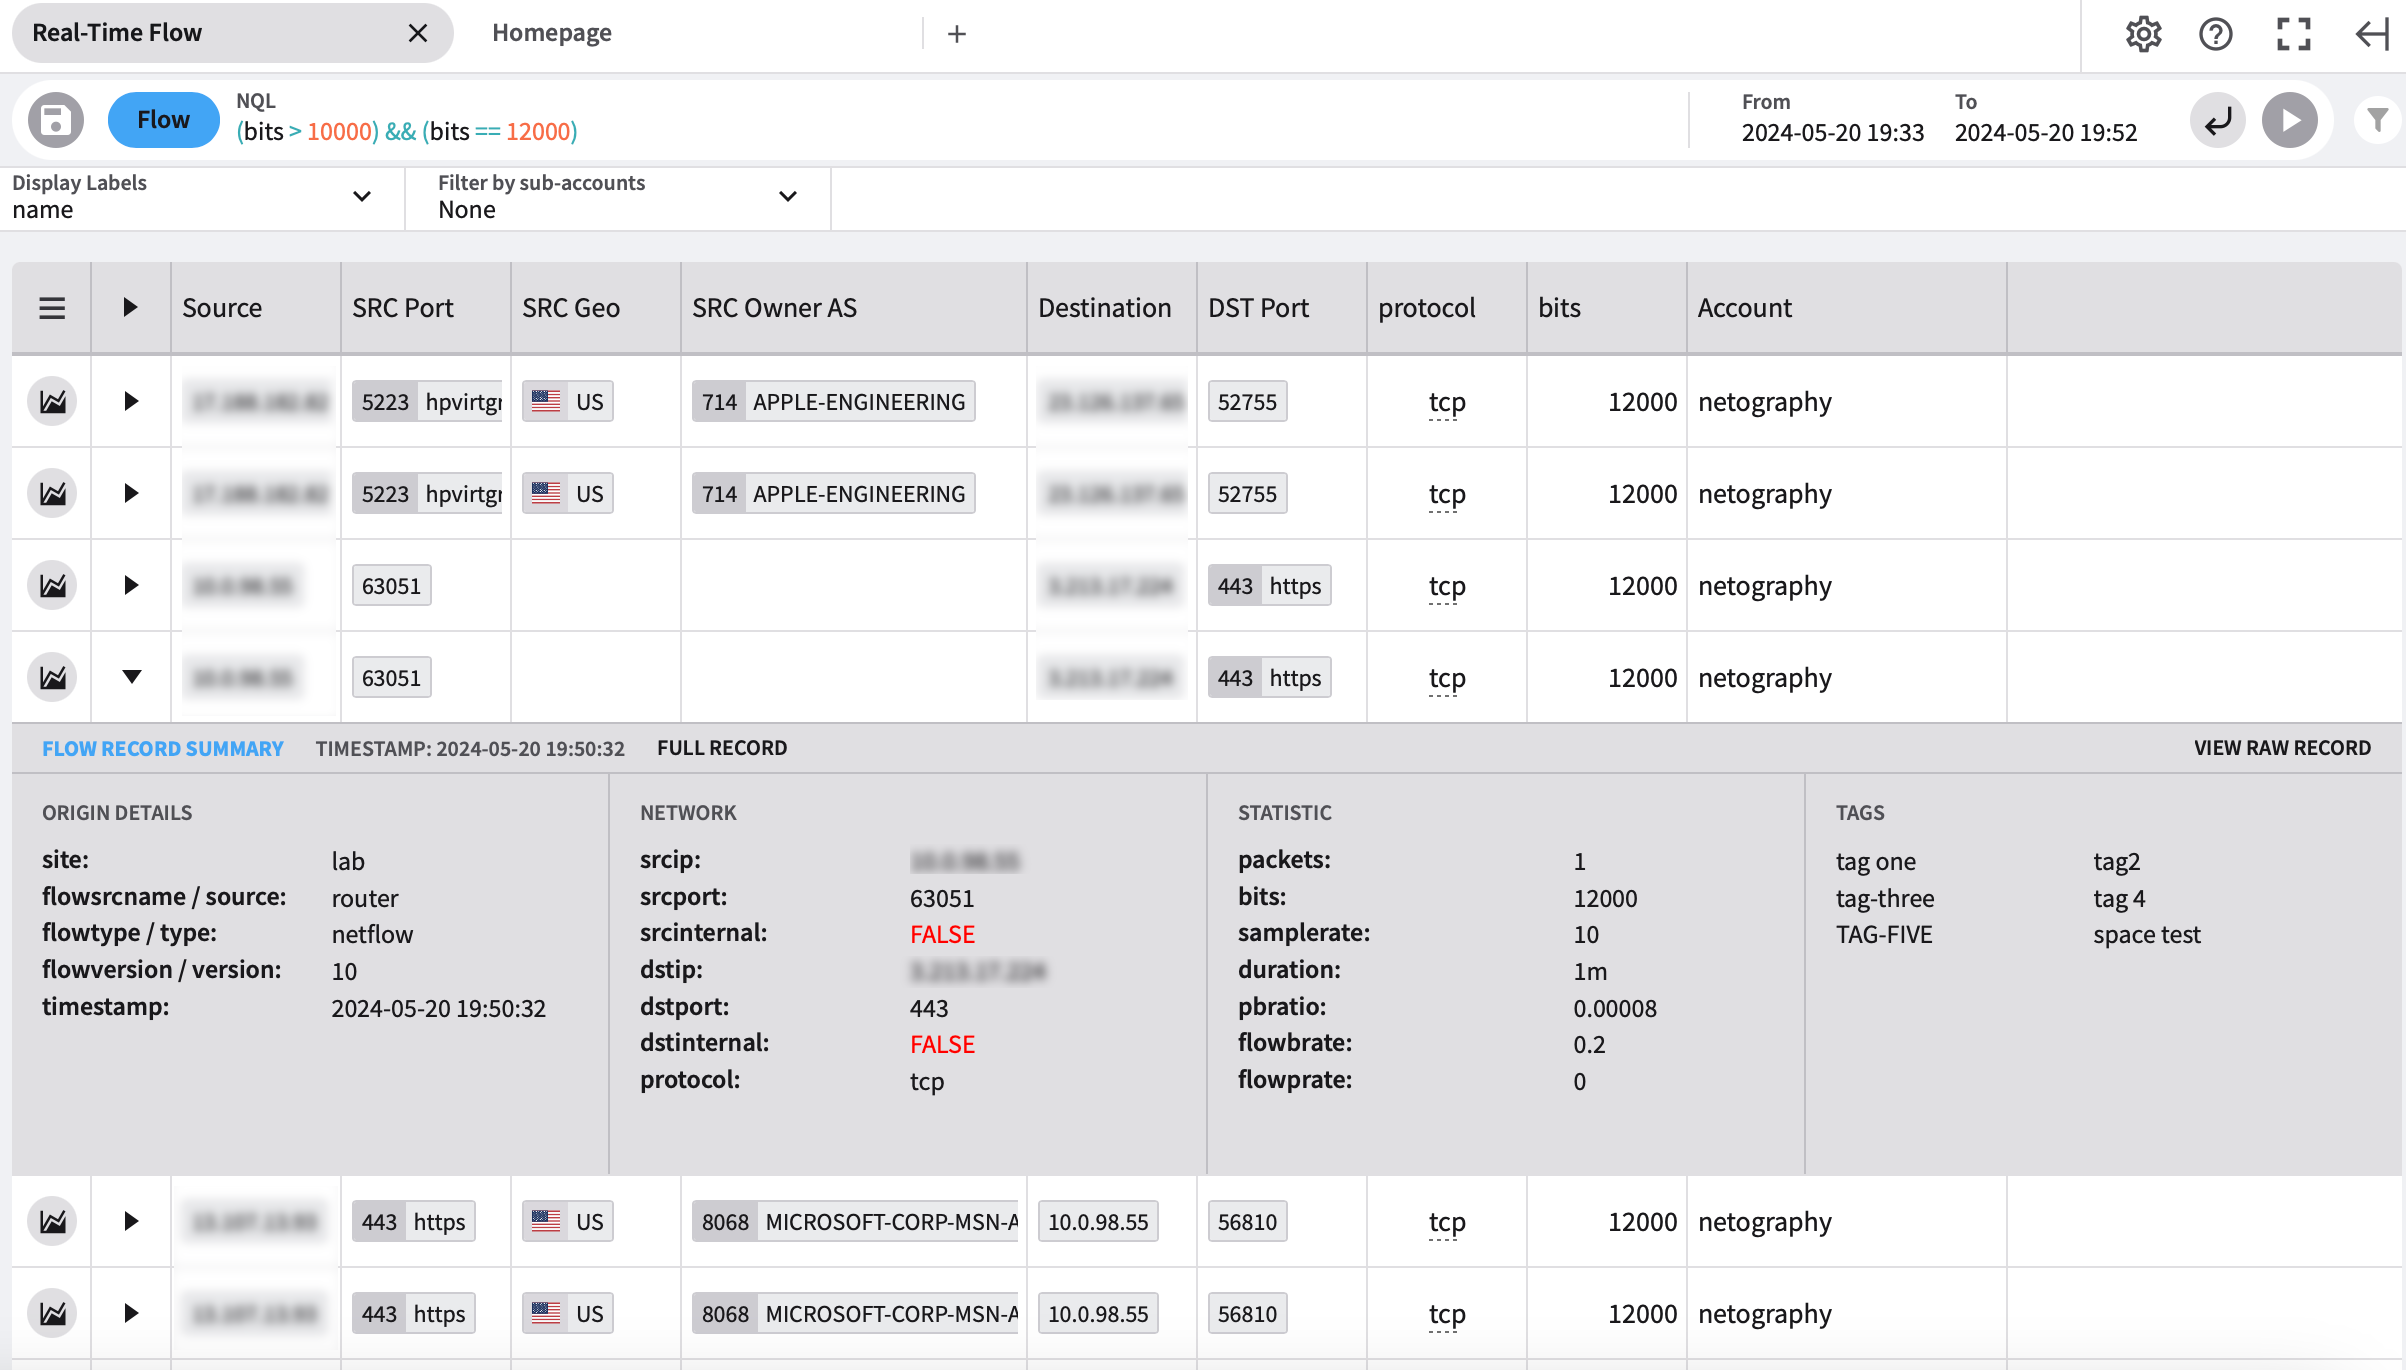
Expanded row details
Table row data is now expandable.
The right-facing triangle indicates expandable row data.
Click the right-facing triangle to expand the row details. Once clicked, the triangle points downwards . You can collapse the row again by clicking the downward triangle .
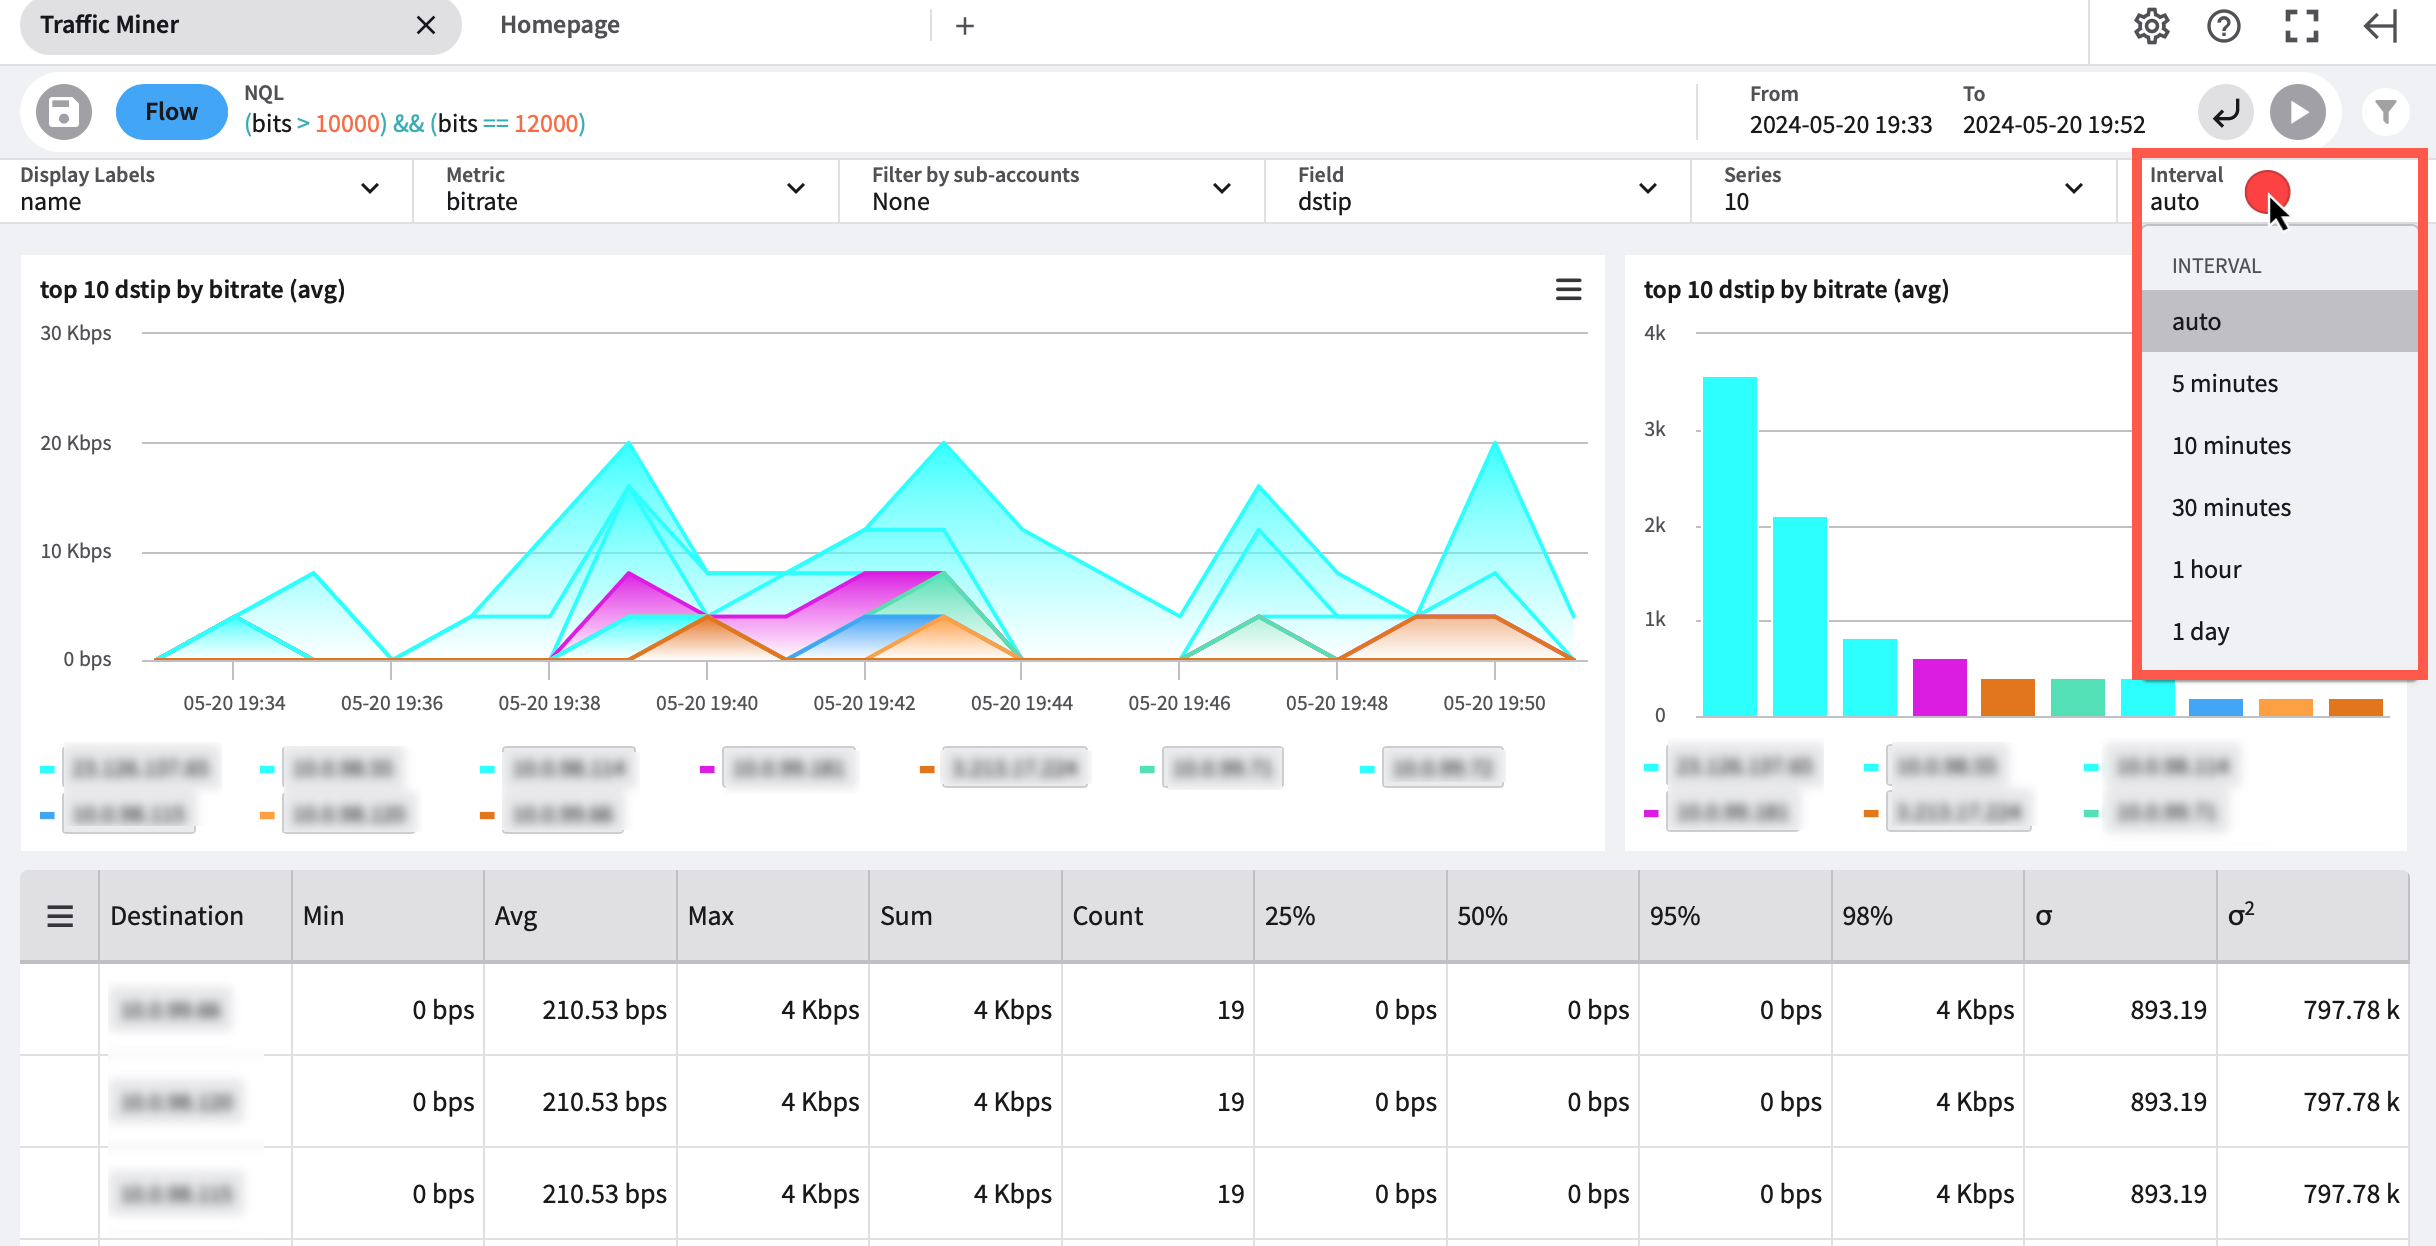
Intervals added to Traffic Miner
Intervals have been added to the Traffic Miner page.
The drop-down menu allows you to select one of the following interval options:
- Auto
- 5 minutes
- 10 minutes
- 30 minutes
- 1 hour
- 1 day
You can group data based on the time interval
If an interval is not selected or provided, the interval will be calculated based on start and end times.
The greater the interval window, the greater the interval.